This proprietary process from Primeum will help you forecast precisely the volumes that your customer is going to order on the coming year.
Real life example:
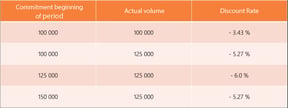
As we clearly see in this example, if the commitment is 100 000 and the actual final value is 100 000, we will apply a discount rate of 3.43 %.
However if the actual value is higher, say 125 000, the discount rate would have been 5.27%, which is better, even if there is a prediction error of 25 000. So the client is rewarded to order more, whatever its commitment was.
Nevertheless, if he had commit to 125 000 at the beginning, then the discount rate would have been 6%, even better!
Moreover, if he had commit to 150 000 with an actual still being 125 000, the discount rate would have been 5.27%, just like 100 000/125 000 example above. This is because the difference, the imprecision in the forecast, is 25 000 (positive or negative) in both cases
This process funnel the client into committing to the most probable volume value it can forecast, not pessimistic nor optimistic. No need to tweak the commitment value in any direction just be ambitious but realistic. When committed, the bigger the better, no need to “pilot” the orders

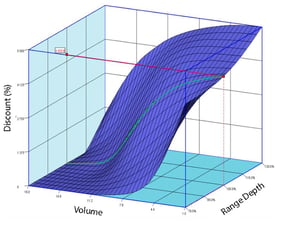
This proprietary process from Primeum allows you to select and combine two KPI to define the discount rate, being volume, margin, buying frequency,…
Using a surface in 3D is the key to be able to define the precise gradient in all points, in effect melting the two KPI together. This implies no possibility to tweak or cheat the system, while permitting a full budgetary control.
The surface can be presented in a tabular form, very easy to use : the discount rate is in the cell where the KPI’s row and column intersect :
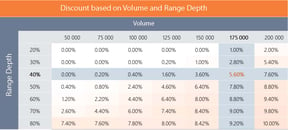
Of course the surface is fully continuous, in tabular format we have to define steps, but the actual computed value is different for each and every KPI pair..